| Home | > | Software | > | Stock Models | > | Forfeiture Tool | > | Forfeiture
& Expected Life
Tool Demo |
Pages:
1 |

Forfeiture & Expected Life Computation
Forfeiture & Expected Life Tool Forfeiture & Expected Life Tool FAQ
Forfeiture & Expected Life Tool Public Company Volatility Service
Download our Whitepaper (494KB)
|
Overview
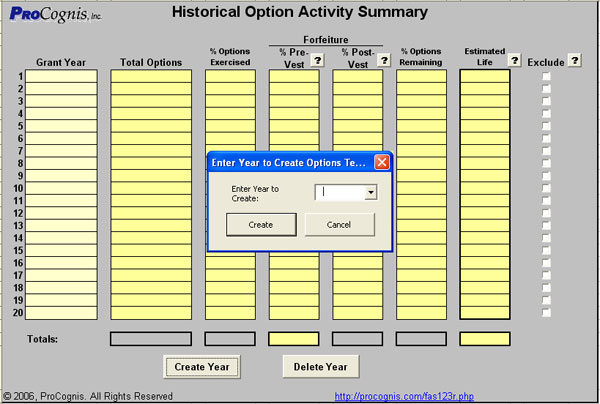
Current Accounting Standards Codification, ASC 718 (formerly FAS123r) requires that companies that issue stock-based payments must now determine a valuation and expense these options in their financial statements. To create an appropriate expense for the stock-based compensation, the compensation rate must be net of expected forfeitures. Historical option forfeiture data can be used to support your forfeiture assumption. The Forfeiture & Expected Life Tool takes existing stock option grant actual behavior and computes the pre-vest and post-vest forfeiture rates from the entered data from actual forfeitures. Both forfeiture and exercise behavior is also used to compute the expected life for use in valuation models. The Black-Scholes-Merton (BSM) stock valuation model requires an expected life input term to define the potential life of the option. This is an important input and strongly effects the overall valuation of stock options. Actual historical data can be used to support the input assumption in the BSM model. Even Binomial Lattice models may benefit from having actual expected life data since this computation may be used to support the conclusions of the Binomial model. The historical grant data is sorted into years based on grant inception date to organize the grants and to make useful comparisons. The first step in using the Tool is to create a year by clicking the 'Create Year' button. Simply enter a year into the drop-down box and click the 'Create' button. (see Figure 1).
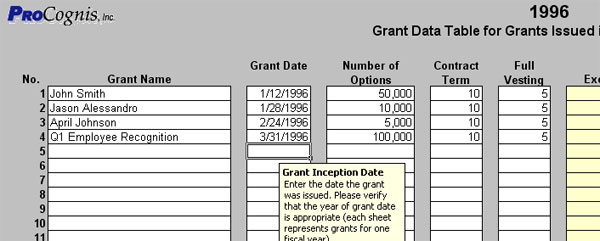
Figure 1. You click the 'Create Year' button to get started and create a Year sheet to store the grant information. The Tool will setup a worksheet for you to enter the grants for this year. You may track the grant name, grant date for each grant along with the important inputs of number of options, contractual term and vesting year (the number of years into the contractual term that all of the options are fully vested). (see Figure 2) Note that there are two versions available: the standard edition which supports up to 100 grants per year and the 1,000 grant per year edition. The standard edition is $299 and the 1,000 grant edition is $399.
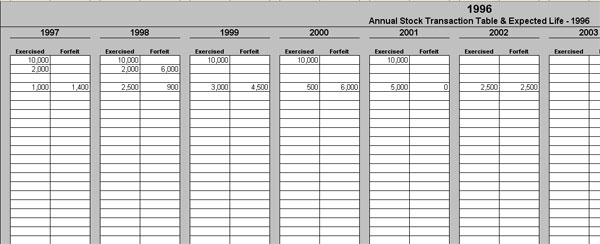
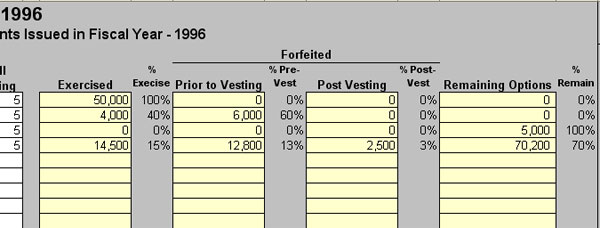
Figure 2. After the year worksheet is created, enter grant information to start collecting the historical data for each grant. The important data inputs include the number of options, the contract term and the full vesting year. These inputs define how the forfeiture rate and expected life are calculated for each grant. After you enter the data for each grant, you will enter the exercise and forfeiture data for each year of the grant to tabulate the forfeiture and exercise behavior. (see Figure 3) As you enter the exercise and forfeiture data, the worksheet calculates the key ratios to provide details on the behavior for each grant. (see Figure 4)
Figure 3. Enter the forfeiture and exercise details for each year to use to create the forfeiture and expected life computations.
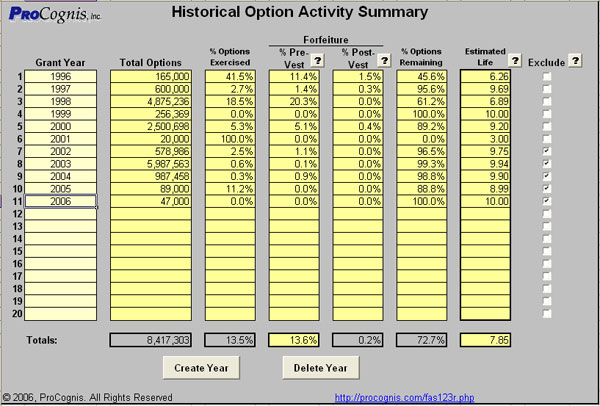
Figure 4. Using the forfeiture and exercise details for each year, the Tool computes the remaining outstanding options and key ratios for the forfeiture computations. Forfeiture & Expected Life Computation Until all of the options are either forfeited or exercised for each grant in each year, the Tool uses the assumption that those options will remain outstanding until the end of each grant's contractual life. This information is used to compute the expected life for each grant and the weighted average (based on the number of shares in each grant) of all of the grants in each year are reported on the 'Summary' sheet. (see Figure 5)
Figure 5. The 'Summary' sheet. Using the forfeiture and exercise details for each year, the Tool computes the forfeiture computations and the expected life. Computed Data Output The data for each year (up to 20 years) is tabulated on the Summary sheet along with the key ratios for each year. Some years may have unusal or non-typical option forfeit and exercise behavior that may skew the weighted averages in the Totals row. To address this, there is a checkbox in the 'Exclude' column that removes the checked year(s) from the computed averages. All of the data from each excluded year is removed from the computation reported in the Totals row below the table of yearly data. There are two data outputs highlighted in yellow in the Totals row. These are the Pre-Vest Forfeiture rate and the Estimated Life. The pre-vest forfeiture rate is the historical rate of pre-vesting forfeiture and the estimated life is the historical estimated life of the options in the included years. The pre-vest forfeiture rate is the rate that should be used to develop the forfeiture adjustment for the compensation expense as defined in ASC 718. The estimated life value can be used to support the Expected Life input to the BSM model. |
Forfeiture & Expected Life Computation from historical option data Easy Computation using historical stock data Troublefree solution for only $299! |
Financial Reporting Solutions
©2006.
ProCognis, Inc. All Rights Reserved. Modified
May 24, 2011
Service
Agreement & Privacy Policy